My second passion alongside coding is writing. Whenever I can combine them, I do.

This weekend I used the DEV API to build a tool that analyzes your articles over time. It's an interactive website where you can enter DEV usernames and get text statistics shown in pretty graphs. The metrics that I chose were reading level, ease of reading, and sentiment analysis.
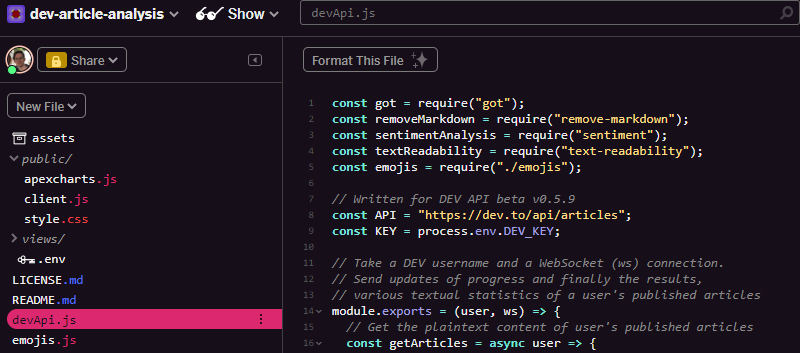
It's open-sourced at healeycodes/dev-article-analysis!
Readability
The Flesch–Kincaid readability tests were developed in the U.S. Navy in the 70s. These scales are used to measure and compare books, newspapers, and articles. In Florida, they are used to encourage readable language in insurance policies.
Florida Statutes Section 627.4145 (1) (a) The text achieves a minimum score of 45 on the Flesch reading ease test as computed in subsection (5) or an equivalent score on any other test comparable in result and approved by the office;
Flesch-Kincaid Grade scores text at a U.S. grade level. A score of 10.4 means that a tenth grader would be able to understand the article.
Flesch reading ease is a similar test with different weightings. It results in a score generally ranging between 0-100. Higher means easier to read. Wikipedia has a table which relates score to grade level with some notes.
Technical articles, especially those with code excerpts, get wide-ranging scores. However, a user's writing style (e.g. a similar amount of code per article) means that a reasonable line can be drawn over time, perhaps leading to some basic conclusions. text-readability was used to calculate these scores in the project.
Sentiment
Sentiment analysis helps us understand the emotional polarity of a text. For example, the phrase I love cats, but I am allergic to them. gives a comparative score of 0.1111111111111111. To calculate this, a list of words (and emojis) are given weightings. -5 to 5, positive to negative. The only tokens in our sentence with scores are { allergic: -2 }, { love: 3 }. We take the number of tokens, 9, and calculate (3 + -2) / 9 to find the comparative score. This example is used in the documentation of sentiment.
The DEV API provides the text of an article in HTML or markdown, neither of which is friendly to analysis. This is why remove-markdown is used to reduce the body_markdown value to plaintext.
Interaction
Users enter a DEV username. As the articles are retrieved, a progress status (and a random positive emoji) are sent to the page via WebSocket. This means the user isn't left sitting looking at a spinner.
I normally use Chart.js to render basic line charts but wondered if there were a simpler solution. I tried ApexCharts.js and didn't run into any problems. The online documentation is good and I searched and found the solution to one of my errors in a GitHub Issue. However, I might as well have used Chart.js because the level of customization I required meant the syntax for both libraries was near-identical.
The charts can be hovered to see article titles and their scores for each metric.
When arriving at the website, the graphs are already filled with precalculated data from my own DEV username (healeycodes). This is to help visitors better understand what the end result of their interaction will be.
Deployment
I developed this Node/Express application on Glitch. Their cloud IDE and console lets me move fast and get feedback from people seconds after I've made a change. You can export the project to a GitHub project (it creates a glitch branch which you can open a pull request from).

Sometimes I want to upload image files and in the past I found this tricky. Glitch wants you to use their asset mechanism for this, which makes exporting the whole project to GitHub harder than it needs to be. My workaround is to upload the image to the project using the asset mechanism, copy the long URL they provide, wget this URL in the console which downloads it into the project, and finally using mv to change the name of the image.
This often brings the cloud IDE out of sync but entering refresh in console fixes this.