Try out my demo player (desktop only).
Counter-Strike 2 (CS2) demos are recorded gameplay files that capture every player's movement, actions, and the overall game state. They're the flight recorder of a match, storing the raw data so that it can be watched later on.
Professional players and analysts use these demos to review their team's performance — and they also spend time watching upcoming opponents to counter strategize. Demos can be watched by loading them in CS2. They can also be parsed using open source libraries like demoinfocs-golang or awpy. There is a range of tools that can be used to watch demos in the browser from a top-down 2D view.
Here's Starcaller's in-browser demo player:
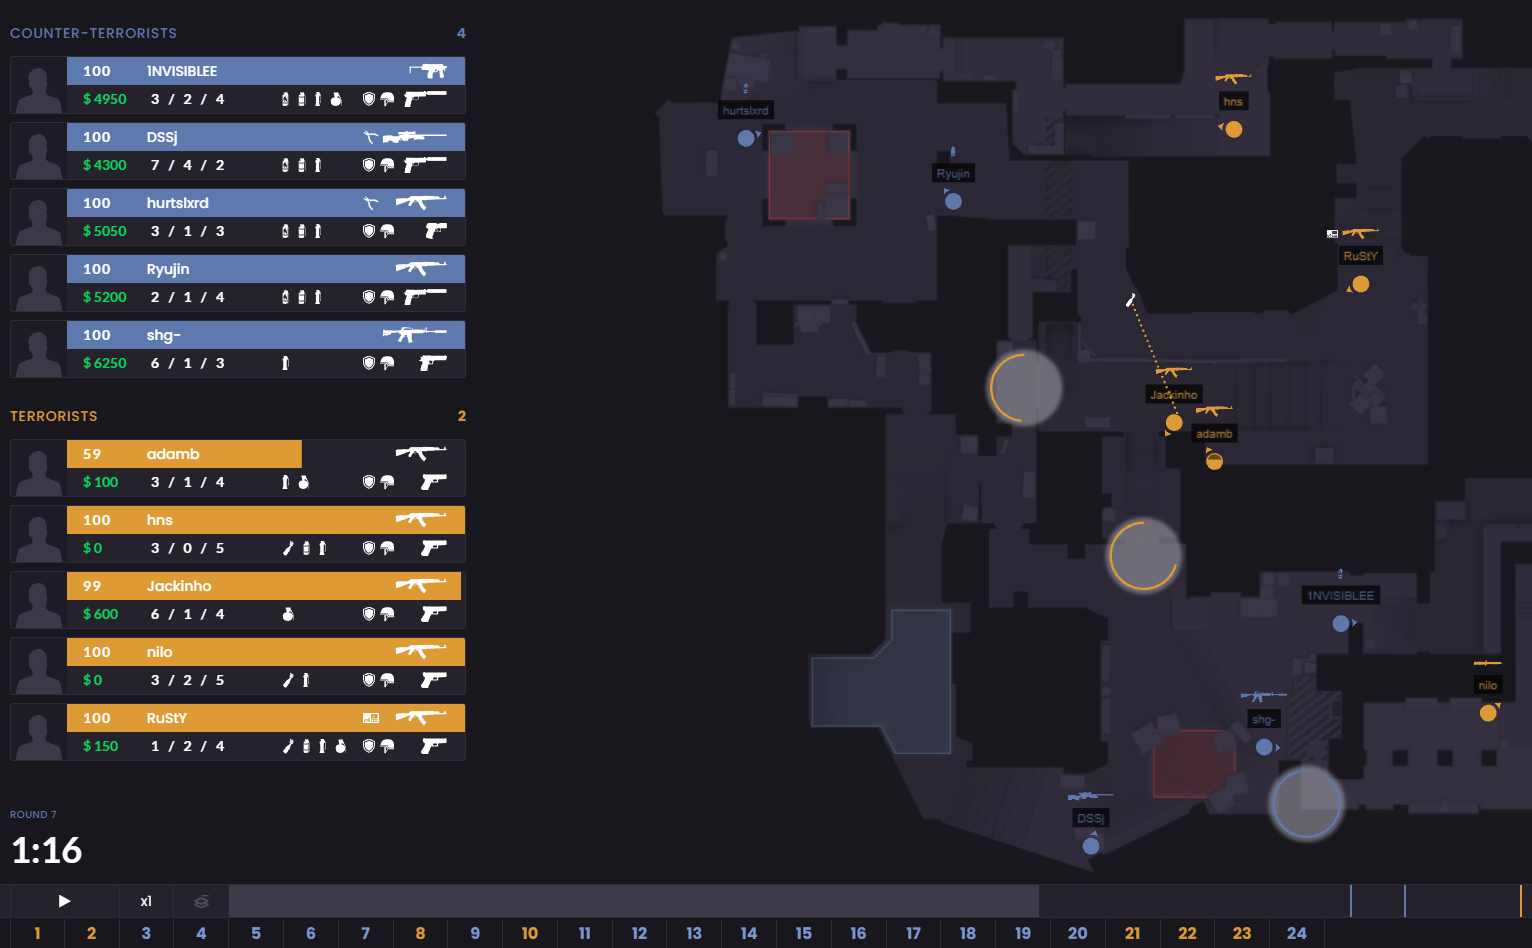
Raw demo data is used to render player equipment and positions, smoke grenades paths and effects, gun shots, and other strategically relevant data. There is also an option to overlay multiple rounds into a single view. This can be used to view the aggregate behavior of certain teams or players during specific types of rounds (e.g. buy rounds).
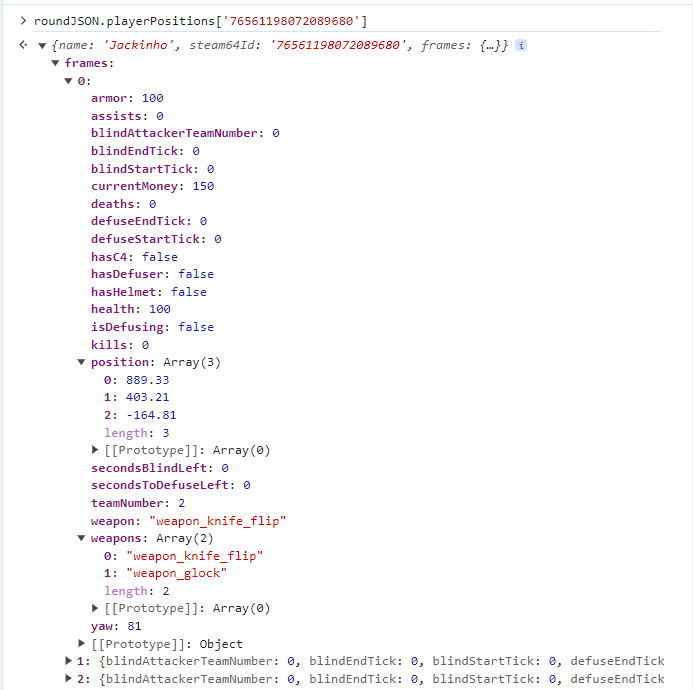
Using Chrome's network tools, I saw that each round is a ~5MB file containing pre-processed demo data. Starcaller's player is written in a JavaScript game engine called Phaser which consumes this data.
I learned about Starcaller when my friend, a professional CS2 coach, was showing me his workflow as he prepared for an upcoming match. He clicked through UI very quickly, filtering his next opponent's matches (official demo files are public) and scanned through different rounds to point out player behaviors and how they might become part of his strategy for an upcoming match. He showed me how he distils this research into a document to be discussed with the rest of his team, with notes and links to certain game rounds in Starcaller to highlight his ideas.
These demo analysis tools are a tactical edge that top gaming organizations pay thousands-per-month for. They are not the most polished pieces of software but that's not really the point. The userbase puts up with a clunky UI because they're functional tools that produce real insights.
As a CS2 fan, I was curious how demos worked on a technical level, and the steps required to process and visualize the data. I set out to build a prototype demo player to feature-match Starcaller's (not including the aggregate views, demo library, filter options, etc.).
Parsing a Demo
Uncompressed demo files are quite large and depending on match length can be up to 500MB. These files contain far more data than is required to render a top-down 2D view of match. With 64 ticks per second and a range of game entities (players, weapons, world objects), it's not a file format that's designed for compactness.
While there are experimental tools that use WebAssembly to parse demo files within a browser, the download time of a demo file (and the long processing time due to the WebAssembly overhead) excludes this method as a viable option.
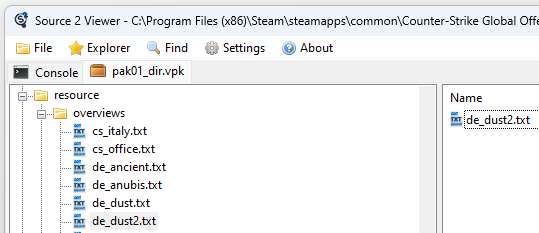
Demos must be pre-processed into a schema that can be consumed by an in-browser player — consisting of a mixture of granular position data and other game events and metadata. World positions need to be scaled to a map image — demoinfocs-golang has a code example for using map metadata to scale a world position. That example hasn't been updated for CS2 yet so I had to use a program called Source 2 Viewer to decompile map images and map metadata from CS2's game files.
Software libraries like demoinfocs-golang allow you to parse a demo frame-by-frame and register callbacks on game events. I had to use both methods. By reading each frame, you can get player positions and other status information (health, currently equipped weapon, etc.). For key game events like nade throws, gunshots, bomb plants, etc., you can use callbacks like this:
p.RegisterEventHandler(func(e events.GrenadeProjectileDestroy) {id := e.Projectile.UniqueID()var team common.Teamif e.Projectile.Thrower != nil {team = e.Projectile.Thrower.Team}if nadeTrajectories[id] == nil {nadeTrajectories[id] = &nadePath{wep: e.Projectile.WeaponInstance.Type,team: team,}}nadeTrajectories[id].path = e.Projectile.Trajectory})
I reverse engineered a few demo players and copied their data model; a game round object has a list of position data, and other game events. Visual playback is produced as a timer increments and a different slice of position and status data is read. The number of other game events is bounded so they can be looped and checked to see if they should also be rendered.
My demo parser is Go program that takes a demo file path (processing a demo file takes ~15sec on my desktop PC) and produces JSON files for a Next.js app. Information needs to be thrown away in order to keep the JSON files from being too large. Instead of using every available position update (64 per seccond), I read a slice of player data every ~200ms.
This time granularity of ~200ms is enough to visualize the required strategic information about player positions and behavior. However, rendering player movement only five times per second is quite stuttery.
This can be fixed with linear interpolation aka lerp. In my demo player, SVGs are drawn over an image of a decompiled radar map. A player is made up of a few elements:
<svg key={player.SteamID64}>{/* Not included here: bullet tracers, player name, player-is-flashed effect */}{/* Place them over the map in their current position */}<g transform={`translate(${x}, ${y}) rotate(${dir}, 0, 0)`}>{/* Use the corner of a reactangle to indicate the player's direction */}<rect transform={`rotate(225)`} width={0.9} height={0.9} fill='white' /><circle r="0.9" fill={sideColor(player.side)} /></g></svg>
The x, y, and dir values here are lerped between the previous player position and the next position. A time value t(in the range 0 to 1) is used to move between a previous value and a future value.
const x = lerp(prevPlayer.pos.x, player.pos.x, t)const y = lerp(prevPlayer.pos.y, player.pos.y, t)const dir = angleLerp(prevPlayer.dir, player.dir, t)
There is a little more complexity involved when lerping between two angles because it's important to show the shortest path between two rotation values (otherwise the player will rotate 359 degrees when they pass over zero instead of the most-likely scenario that they rotated two degrees).
function lerp(from: number, to: number, t: number) {t = Math.max(0, Math.min(1, t));return from + (to - from) * t;}function angleLerp(a: number, b: number, t: number): number {a = normalizeAngle(a);b = normalizeAngle(b);const delta = ((b - a + 540) % 360) - 180;const interpolatedAngle = a + delta * t;return normalizeAngle(interpolatedAngle);}
Armed with a few lerp functions, player movement becomes as smooth as the user's screen's refresh rate.
Rendering Grenades
A critical aspect of CS2 strategy is the timing and placement of grenades. Both your team's grenades and the opposing team's grenades. Knowing where to hide to counteract the opponents flashes, when to throw molotovs to stop a bombsite rush, what certain smoke timings mean, etc.
Demoinfocs-golang provides a GrenadeProjectile which has a TrajectoryEntry list containing the world positions, frame ids, and timing of a grenade's trajectory entries. Like player positions, these coordinates must be scaled to the map image.
In my demo player, as the playback clock passes each trajectory entry's time, a line is drawn from the nade's origin to the next point (and from the next point to the next, and so on). Additionally, an SVG of the grenade (decompiled from CS2's source files) is placed at the furthest point.
However, much like the 200ms stuttering problem of rendering player positions, there is an additional step required. A naive implementation will make it look like the grenades are teleporting between each trajectory entry (recorded at throw, bounce, and destroy events).
It needs to be lerped! By working out the progress of time between two trajectory entries, we can draw a partial line that smoothly grows to roughly match the grenade's flight. The parabolic nature of CS2 grenades means that the speed between each point is not exactly linear but from a strategic POV this is irrelevant.
// Get the progress between start and end in the range 0-1function progress(start: number, end: number, current: number) {const percent = (current - start) / (end - start);return Math.min(Math.max(percent, 0), 1);}const t = progress(lastTrajectory.time, nextTrajectory.time, currentTime);const x = lerp(lastTrajectory.pos.x, nextTrajectory.pos.x, t)const y = lerp(lastTrajectory.pos.y, nextTrajectory.pos.y, t)// And then, roughly, do this// for each nade trajectory:<svg key={`${nade.id}-${i}`} ><g>{/* A line between each trajectory aka every throw/bounce/destroy event */}<linex1={lastTrajectory.pos.x}y1={lastTrajectory.pos.y}x2={x}y2={y}style={{ stroke: nadePathColorForSide(nade.side), strokeWidth: 0.18, strokeDasharray: 0.5 }}/>{/* Icons are consistently sized so these offsets are fixed */}{weaponIcon(icon, `translate(${x - 0.60}, ${y - 1}) scale(0.06)`, 'rgba(255, 255, 255, 0.9)')}</g></svg>// When a nade is destroyed render the flash, smoke, fire effects// ..
The lines now more accurately visualize the realtime grenade paths.
Framerate
Tools for professional gamers need to be fast. In fact, this is the first feedback I received when I shared my prototype. My demo player had smooth playback ... but they didn't "play" it. They scanned through gameplay rounds by dragging the slider — which caused my player to stutter because I hadn't optimized for that use case yet!
Through trial and error, I ended up with this general structure in my highest level component. A setInterval every 200ms advances through frames containing position information, and another setInterval every 2ms applies lerp and other smoothing effects to this position data, and handles other current game events (like nades in flight). React makes draw calls as often as this second interval.
// Increment through player data slices (aka frames)useEffect(() => {// Calculate round time for display, set it// ..// Set player status for non-map UI// ..const intervalId = setInterval(() => {// Increment frame index, set itsetFrameIndex(frameIndex => frameIndex + 1)}, FRAME_TIME) // 200msreturn () => clearInterval(intervalId);}, []);// Increment render timeuseEffect(() => {const intervalId = setInterval(() => {// The render logic section further down takes ~1ms// so this interval can be set to run _very_ often// to support a fast framerate during slider scanningsetRenderTime(Date.now())}, RENDER_TIME) // 2msreturn () => clearInterval(intervalId);}, []);// Render logicuseEffect(() => {const curFrame = curRound.Frames[frameIndex]const players: React.JSX.Element[] = []// Our time value, used for all the lerpingconst t = progress(lastTick, lastTick + FRAME_TIME, Date.now())// Loop player positions, push groups of SVGs onto `players`// ..// Generate non-player objects like nades/nade paths/etc.// by looping over all of that data (remember, it's bounded in size)// ..setSVGItems(players)}, [renderTime]);return (<div>{/* Draw map image */}{SVGItems}{/* Draw other UI */}</div>)
UI
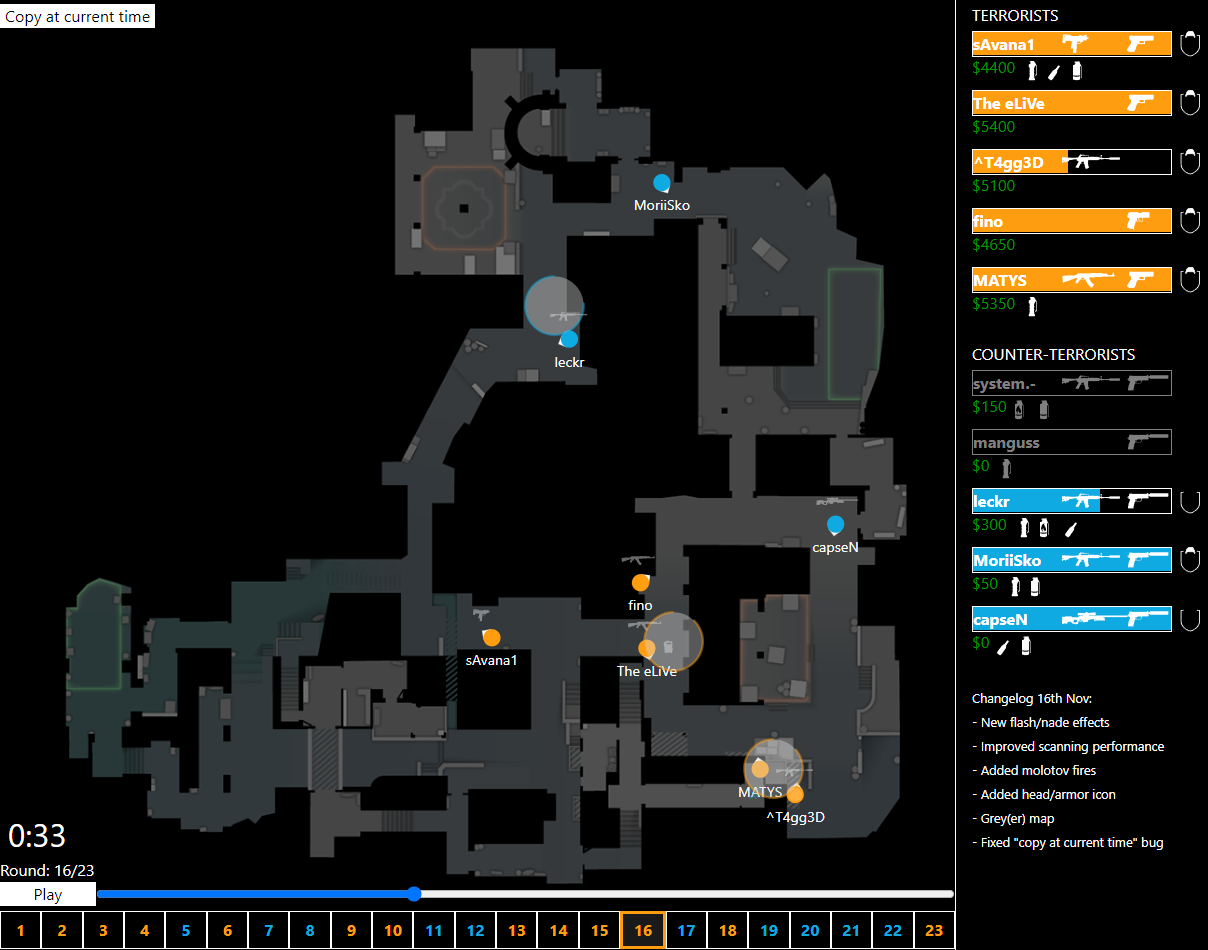
The user interface of my player is functional and received rave reviews like "that works" and "not easy on the eyes but contains all the information I need" — which is exactly the kind of thing I was hoping for my prototype.
Player sprites have a team color, a direction, a current weapon, and whether they are the bomb carrier. When they are flashed, their circle is shaded white and then fades as they become unflashed. The icons are more decompiled game files. I had to create the mapping from demoinfocs-golang entity names to CS2 internal names by hand (this was a little tedious).
You can try out the demo player but be warned that it doesn't really work on mobile yet (I haven't found a customer of these kinds of tools who uses them on mobile yet, and my demo player is just a prototype for now), and I haven't optimized the per-round JSON splitting so there's an intial download of ~20MB for all the rounds.
A while ago, I traded serious amounts of gaming for serious amounts of coding. There's always room for gaming in my heart and this project has been fun to iterate on, it took me an average of ~1.5hrs an evening for two weeks to go from drawing simple player paths on an image to a feature-complete demo player (albeit missing the capability to upload your own demos, etc.)
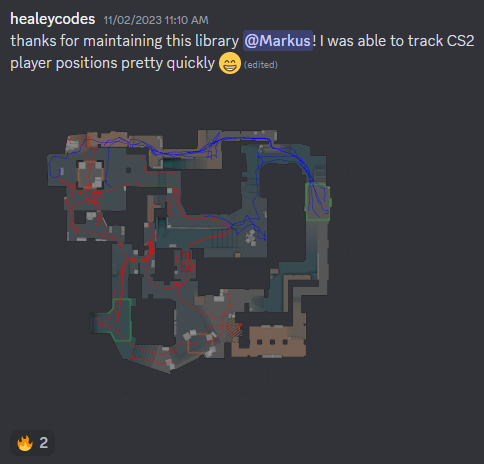
I'll repeat my kudos for markus-wa that I posted in demoinfocs-golang's Discord. It's a delightful open source library.
Are you a software engineer working on game analysis tools? I'd love to talk shop!