In my contract with my ISP, they gave me a range of speeds to expect but also a speed that was the guaranteed minimum. If they aren't able to keep above this minimum, I'm eligible for a discount a few times per year.
I didn't want to sit spamming speedtest.net to check when my speeds were getting low. I wanted to know if there had been dips. Were the dips at the same times? Was there a pattern? I needed data and some data visualization to know if/when I might be eligible for any discounts and whether it was worth pursuing.
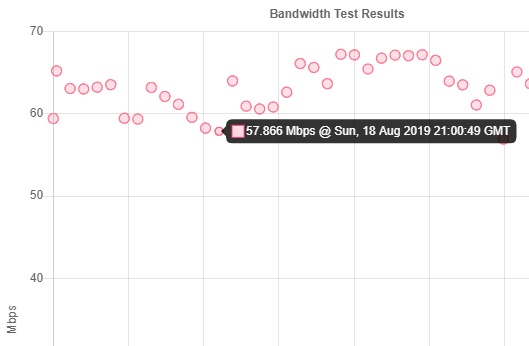
Something like this
Running on my trusty Raspberry Pi. Powered via a USB cable from the router and connected via ethernet so the results (barring other network use) should be reliable.

Over-designed
I started this project off way too complicated. I used a web browser automation framework called Selenium to visit Netflix's fast.com bandwidth test to check my speed. It used a headless Chromium instance.
# wait for test to finish i.e. when 'your speed message' is shownWebDriverWait(driver, 120).until(expected_conditions.presence_of_element_located((By.CSS_SELECTOR, FAST_COMPLETE_CSS)))
Not only was this quite brittle and vulnerable to CSS changes (which had to be hardcoded, see above) it also meant that any users of this project needed to get headless Chromium setup for Raspbian (the default Linux distro for Raspberry Pi). After troubleshooting this and getting it running, I realized it was over-designed.
Using this method remains an option in the project (browsertest.py) but it gives less accurate results on Raspberry Pis due to the browser overhead. Note: this project works on any platform but is mainly targetted towards Pis.
I discovered late in the game that speedtest.net have a great CLI library and I should have used it from the start. Here's how I get the download speed in clitest.py.
import speedtest# ..def get_speed():"""Use Speedtest CLI to test bandwidth speed.:return: Download speed in Mbps"""s = speedtest.Speedtest()s.download()results_dict = s.results.dict()return results_dict['download'] / 1048576 # convert bits to megabits
This script runs via crontab and is pointed at the server. A command similar to python clitest.py 'https://server-location/save' 'password' runs every half an hour. The Windows alternative is Task Scheduler but I believe it's clunkier.
Back-end
I thought it would be neat to be able to check my speeds from anywhere so I created a Glitch project to store, receive, and host the results. It's an Express/Node project that has two API routes.
Results are sent to /save along with a password, which is set via an environmental variable on Glitch.
A slice of results can be read from /read in JSON. Here's what the Express route for that looks like.
// get bandwidth test results for graphing hereapp.get("/read", function(request, response) {const data = db.get("results").value();const prepared = data.map(s => {return { x: s.date, y: Number(s.speed).toFixed(3) };});const trimmed = prepared.slice(Math.max(prepared.length - 48, 1));response.send(trimmed); // send a slice of results});
For storage, I wanted something that didn't require any setup at all. lowdb is a small local JSON database and it's perfect because there's only ever going to be one process reading or writing, and the write event occurs every half an hour or so. lowdb creates the 'database' file if it doesn't already exist.
Quick data visualization
Chart.js is the go-to library for graphs in JavaScript and uses the Canvas API. It's batteries-included and looks nice by default (but perhaps I'm just used to the style!). It's about fifty lines, including the API call.
fetch('/read').then(response => response.json()).then(json => renderGraph(json));const safeDate = time => new Date(parseInt(time)).toUTCString();const renderGraph = (speedData) => {let ctx = document.getElementById('myChart').getContext('2d');let myChart = new Chart(ctx, {type: 'scatter',data: {datasets: [{data: speedData,backgroundColor: () => 'rgba(255, 99, 132, 0.2)',borderColor: () => 'rgba(255, 99, 132, 1)',borderWidth: 1,pointRadius: 5,}]},options: {scales: {xAxes: [{type: 'linear',position: 'bottom',ticks: {userCallback: (label, index, labels) => safeDate(label)},scaleLabel: {display: true,labelString: 'Date'}}],yAxes: [{scaleLabel: {display: true,labelString: 'Mbps'},ticks: {beginAtZero: true}}],},title: {display: true,text: 'Bandwidth Test Results'},legend: {display: false,},tooltips: {callbacks: {label: function(tooltipItem, data) {return `${tooltipItem.value} Mbps @ ${safeDate(tooltipItem.label)}`;}}}}});}
I find it easy to play around with Chart.js and like JavaScript it's very productive if you want to throw something together. The docs are great and it's a large enough library that common searches will find helpful StackOverflow answers.
Where to go from here
So far my speeds have been hovering around the guaranteed minimum, usually dipping just under around 8pm local time. At current, I have no reason to complain! A pleasant surprise.
It will be straightforward to diagnose any future bandwidth problems as I now have an up-to-date record of my speeds. Hopefully, some of this project's code will help you diagnose any simple problems with your bandwidth throughout the day.